explore now

MARKET SHARE OF COMPANIES
Band 7 Answer:
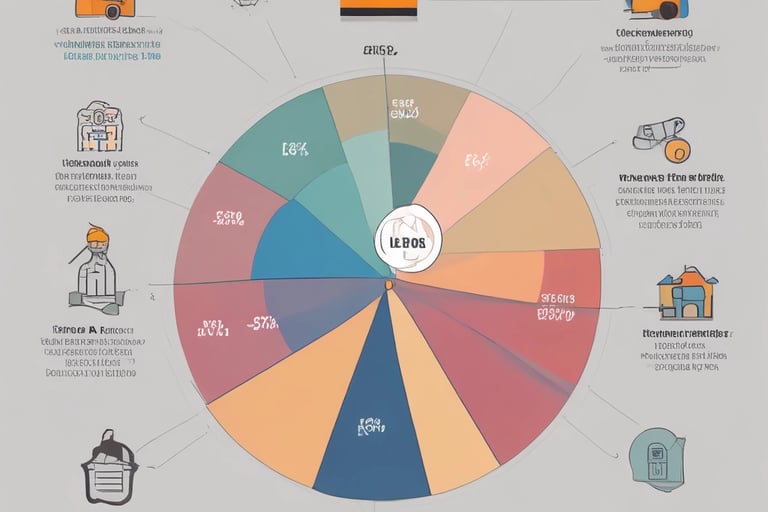
The pie chart shows the market share held by four groups of companies, namely Company A, Company B, Company C, and all other competitors combined. Overall, it is clear that Company A dominates the market, while smaller companies collectively represent the smallest proportion.
Company A accounts for 40% of the total market, which is considerably higher than the other three categories. This indicates its strong position and influence within the industry. Company B follows with 25%, showing a moderate but still significant role. Company C holds a market share of 20%, which is slightly smaller than that of Company B but still represents an important contribution. The remaining 15% of the market is shared among various smaller companies grouped as “others.”
The figures suggest that the market is highly concentrated in the hands of a few major players, particularly Company A, which controls nearly half of the market. Although Companies B and C are also competitive, their shares are clearly smaller. By contrast, the group of smaller firms has limited influence, holding only a minor part of the industry.
Band 8 Answer:
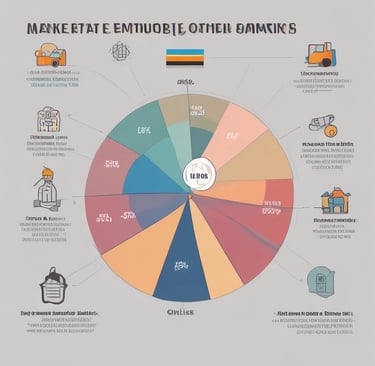
The pie chart illustrates the market share distribution among four categories: Company A, Company B, Company C, and other smaller competitors. A clear pattern can be observed, with Company A holding the largest proportion, while the remaining companies share the rest of the market.
Company A leads the market with 40%, establishing itself as the most dominant player in the industry. This figure is substantially higher than those of its rivals and highlights its competitive advantage, which may stem from factors such as brand reputation, customer loyalty, or strong distribution networks. Company B comes second, accounting for 25% of the market. Although significantly smaller than Company A, it still occupies a solid position, suggesting a degree of stability and competitiveness.
Company C holds 20%, slightly behind Company B. While this figure shows that it plays a meaningful role in the market, its overall share remains limited when compared with the leading firm. The category labelled “others” represents only 15% of the market, reflecting the relatively weak position of smaller firms, which together hold less influence than any of the main three companies.
Overall, the chart demonstrates that the market is concentrated, with a single company clearly ahead of its competitors. The combined share of Companies B and C is still smaller than that of Company A alone, indicating an imbalance in market power. At the same time, the relatively low percentage of smaller firms suggests significant barriers to entry, such as high competition or limited resources. This structure implies that a few dominant companies largely shape the industry, leaving limited space for smaller participants to expand.