explore now

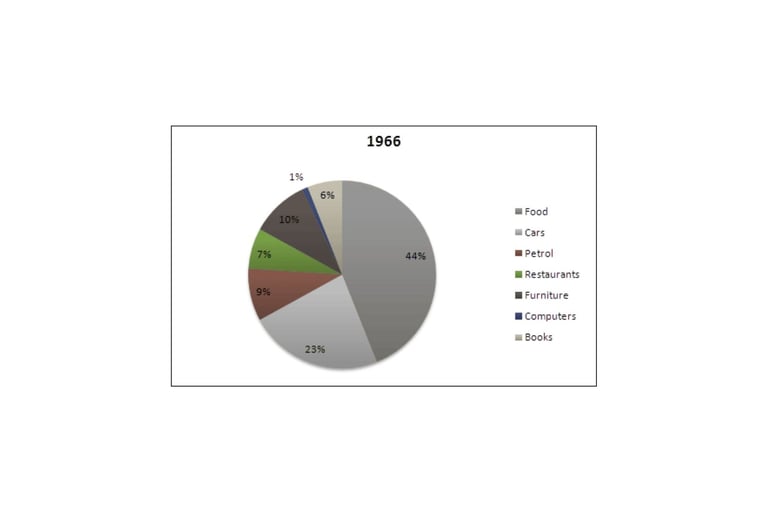
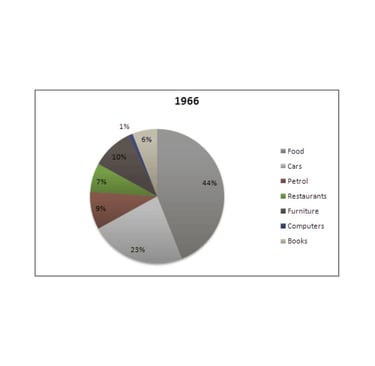
HOUSEHOLD SPENDING PERCENTAGES
Band 7 Answer:
The pie chart illustrates the distribution of household spending across four categories: food, housing, transport, and others. Overall, the largest share of expenditure is devoted to food, while the smallest portion is allocated to other miscellaneous items.
Food accounts for 35% of total household expenditure, making it the most significant category. This is followed by housing, which represents 30% of the budget, a figure slightly lower than food but still a substantial portion of overall spending. Transport stands at 20%, showing that families dedicate about a fifth of their budget to commuting and travel. Finally, the “others” category makes up 15%, which includes various smaller expenses such as clothing, entertainment, and healthcare.
The data clearly suggests that essential needs dominate household spending. Food and housing together account for nearly two-thirds of the total budget, highlighting the importance of nutrition and accommodation. Transport, though less dominant, still represents a considerable amount of money, indicating the role of mobility in people’s lives. In contrast, other expenses receive the least financial attention, suggesting that families prioritize survival and shelter before leisure or non-essential goods.
Band 8 Answer:
The pie chart provides information on how households allocate their expenditure across four categories, namely food, housing, transport, and others. A clear trend can be observed, with basic needs such as food and housing taking up the majority of total spending, while discretionary expenses are relatively limited.
Food represents the largest share of household spending at 35%. This indicates that a significant portion of family income is devoted to nutrition, which is an essential requirement for daily life. Housing follows closely at 30%, reflecting the substantial costs associated with accommodation, such as rent, mortgages, and utilities. Together, these two categories account for 65% of total expenditure, showing that most financial resources are directed towards meeting fundamental living needs.
Transport accounts for 20%, which, although smaller than the other two categories, is still notable. This proportion suggests that families spend a significant amount of their income on commuting, fuel, and possibly leisure-related travel. The final category, “others,” stands at 15%, covering a wide range of minor expenses, including clothing, healthcare, and entertainment. Its relatively small proportion suggests that households have limited resources left for non-essential or luxury items after addressing food, housing, and transport costs.
Overall, the chart highlights a strong emphasis on necessities within household budgets. The high percentages for food and housing demonstrate their unavoidable importance, while the lower figures for transport and other expenses reflect secondary priorities. This distribution may also suggest that households have little flexibility to allocate resources beyond essentials, which could impact lifestyle choices and savings.