explore now

COMPARISON OF COUNTRIES
GDP.POPULATION,LITERACY RATES
Band 7 Answer:
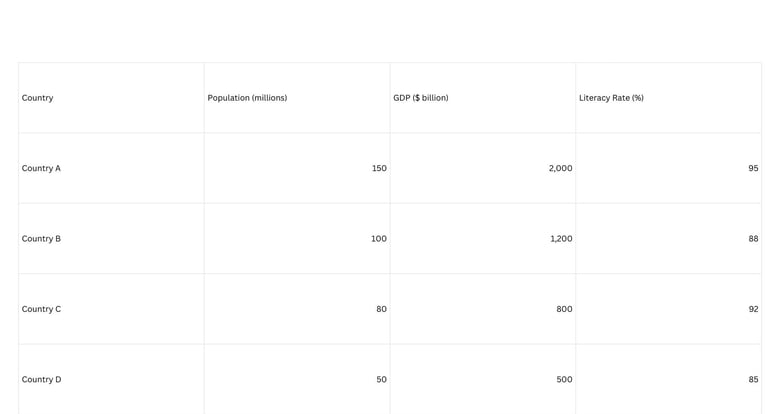
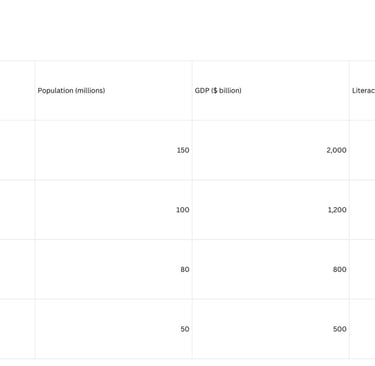
The table compares four countries in terms of population, GDP, and literacy rate. Overall, it is clear that Country A has the largest population and the highest GDP, while Country D has the smallest population and GDP.
Country A has 150 million people and a GDP of $2,000 billion, with a literacy rate of 95%, which is the highest among the four countries. Country B has 100 million people and a GDP of $1,200 billion, with a literacy rate of 88%. Country C is smaller, with 80 million people and a GDP of $800 billion, but it has a relatively high literacy rate of 92%. Country D has the smallest population at 50 million and the lowest GDP of $500 billion, along with a literacy rate of 85%.
The data suggests that larger populations are associated with higher GDPs, but not necessarily the highest literacy rates. Overall, Country A is the most developed in terms of both economy and education, while Country D lags behind in all three categories.
Band 8 Answer:
The table provides a comparison of four countries, highlighting their population, GDP, and literacy rate. Overall, Country A stands out as the largest and wealthiest nation, whereas Country D has the smallest population and the lowest economic output.
Country A has a population of 150 million and the highest GDP of $2,000 billion, with a literacy rate of 95%, indicating a highly educated society. Country B has a population of 100 million and a GDP of $1,200 billion, with a slightly lower literacy rate of 88%. In comparison, Country C is smaller, with 80 million people and a GDP of $800 billion, but it maintains a relatively high literacy rate of 92%, suggesting effective education despite a smaller economy. Country D, with 50 million people and a GDP of $500 billion, records the lowest literacy rate at 85%, highlighting a less developed educational system.
The data reveals that higher population often coincides with larger GDP, although literacy rates do not always align perfectly with economic size. While Country A demonstrates strong performance across all indicators, Country C shows that a smaller economy can still achieve high literacy. Overall, the table emphasizes disparities among nations in terms of population, wealth, and educational outcomes, suggesting varying levels of development and social investment.