explore now

CHART SHOWING CAUSE AND EFFECT
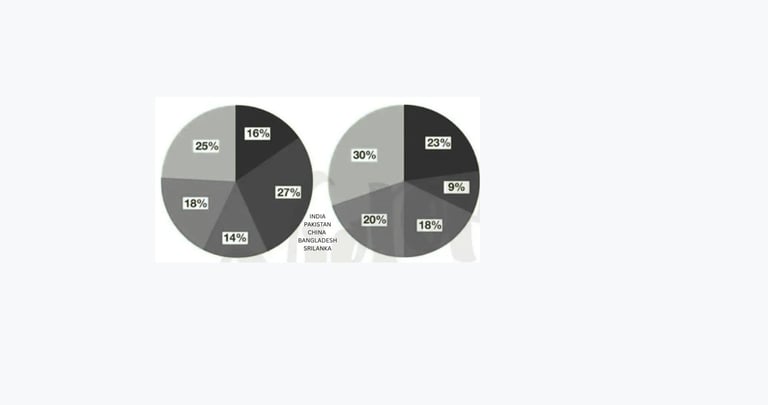
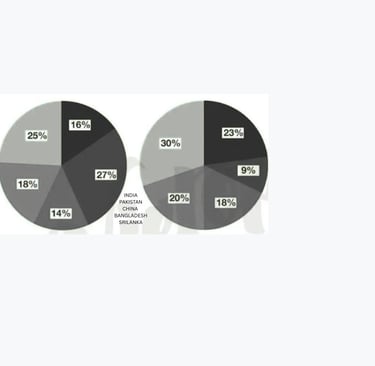
POPULATION VS RESOURCES
📊 Population vs. Resources
Band 7 Answer
The chart compares population growth with the availability of resources over time. Overall, it illustrates that as the population rises, pressure on natural resources increases, leading to shortages.
At the beginning of the period, population levels were relatively low while resources such as food, water, and energy were sufficient. However, with rapid population growth, the gap between demand and supply gradually widened. In particular, food production and fresh water supplies showed slower growth compared to population.
By the end of the period, the population reached its peak, while resource levels failed to keep pace. This imbalance suggests that rising population is a major factor contributing to resource depletion and scarcity.
Band 8 Answer
The chart illustrates the relationship between population growth and resource availability across a given period. Overall, it demonstrates a clear cause-and-effect pattern in which accelerating population growth leads to mounting pressure on limited resources.
In the early stages, population levels increased gradually, while resources such as food, water, and energy remained relatively stable. This balance ensured that basic human needs were met without significant shortages. However, as the population began to expand more rapidly, the rate of resource consumption also accelerated. Agricultural production and energy output struggled to match the rising demand, while fresh water availability showed only minimal growth.
As the population curve steepened, the resources curve flattened, indicating that supply could not keep up with demand. By the end of the period, the population had reached its highest point, whereas resources had reached a plateau. This widening gap highlights the direct effect of population growth on resource scarcity, suggesting that overpopulation is a key driver of environmental stress, economic challenges, and potential conflicts over access to essential goods.