explore now

ANNUAL RAINFALL OR CLIMATE DATA
9/21/20252 min read
Band 7 Answer:
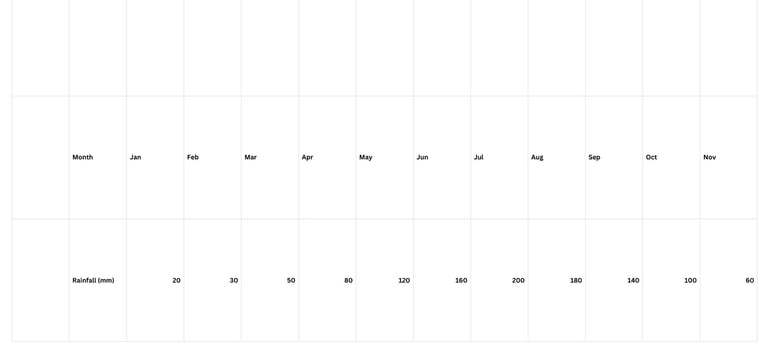
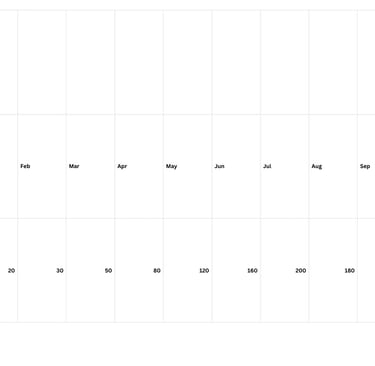
The table illustrates the average monthly rainfall in a city. Overall, it is clear that rainfall increases during the middle of the year and decreases at the beginning and end.
January has the lowest rainfall at 20 mm, followed by a gradual increase to 30 mm in February and 50 mm in March. Rainfall continues to rise in April and May, reaching 80 mm and 120 mm respectively. The wettest months are June and July, with 160 mm and 200 mm, after which it declines to 180 mm in August. Rainfall decreases further to 140 mm in September and 100 mm in October. November sees 60 mm, and December returns to the lowest level of 20 mm.
The data indicates a clear seasonal pattern, with a wet season in the middle of the year and a dry season at the start and end. Overall, the rainfall rises and falls regularly, suggesting predictable climate conditions for the city.
Band 8 Answer:
The table presents the average monthly rainfall in a city throughout the year. Overall, there is a clear seasonal trend, with rainfall increasing gradually from the start of the year, peaking in midsummer, and then decreasing towards the end.
Rainfall begins at 20 mm in January and rises slightly to 30 mm in February and 50 mm in March. The increase becomes more pronounced in April and May, reaching 80 mm and 120 mm respectively. June and July are the wettest months, with 160 mm and a peak of 200 mm in July. Although rainfall remains high in August at 180 mm, it starts to decline steadily in September to 140 mm and October to 100 mm. By November, it falls to 60 mm, and in December it drops back to 20 mm, equal to January.
The data clearly shows a wet season in the middle of the year and a dry season at both ends, reflecting a predictable climate pattern. Such variations may result from monsoon cycles or other regional climatic factors. The consistent rise and fall of rainfall each month indicate stable seasonal changes, which can be important for agriculture, water management, and tourism planning. Overall, the city experiences substantial fluctuations in rainfall, with a pronounced peak in midsummer and considerably lower precipitation in winter.